max planck institut
informatik
informatik

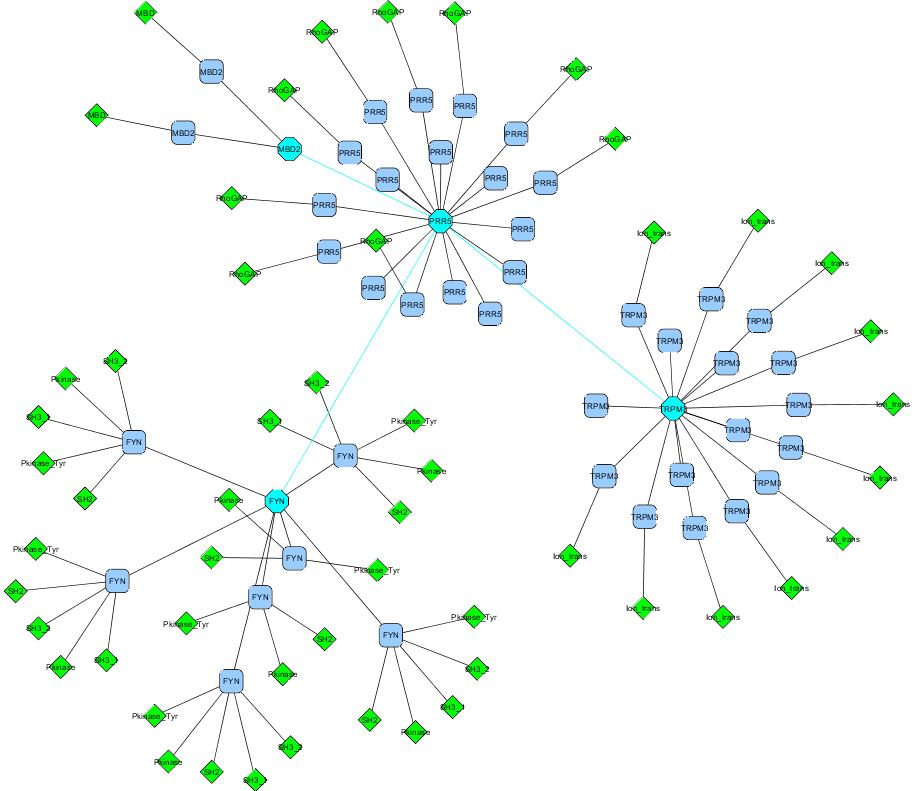
The user has to import a gene or protein interaction network of interest. DomainGraph supports the same file formats as Cytoscape for import, but users may also select a network imported via Cytoscape directly. For a gene interaction networks, the main focus is on the encoded protein isoforms and their domain compositions (click here for a sample output of a gene interaction network). Thus, the genes are visualized together with all encoded isoforms and their domains. For protein interaction networks, the focus is on the given protein isoforms and their underlying domain-domain interactions. The resulting network thus consists of the specific proteins, their domain compositions and the potential domain-domain interactions (click here for a sample output of a protein interaction network).
| Supported gene identifiers: |
|
| Supported protein identifiers: |
|
| Supported species: |
|
| Domain-domain interaction datasets: | DomainGraph includes several structure-based and predicted datasets for inferring domain interactions. Please refer to Database Information for further information. |
For a domain graph, you can choose one of two different views for gene networks and three different views for protein networks (and you can switch between them at any time):
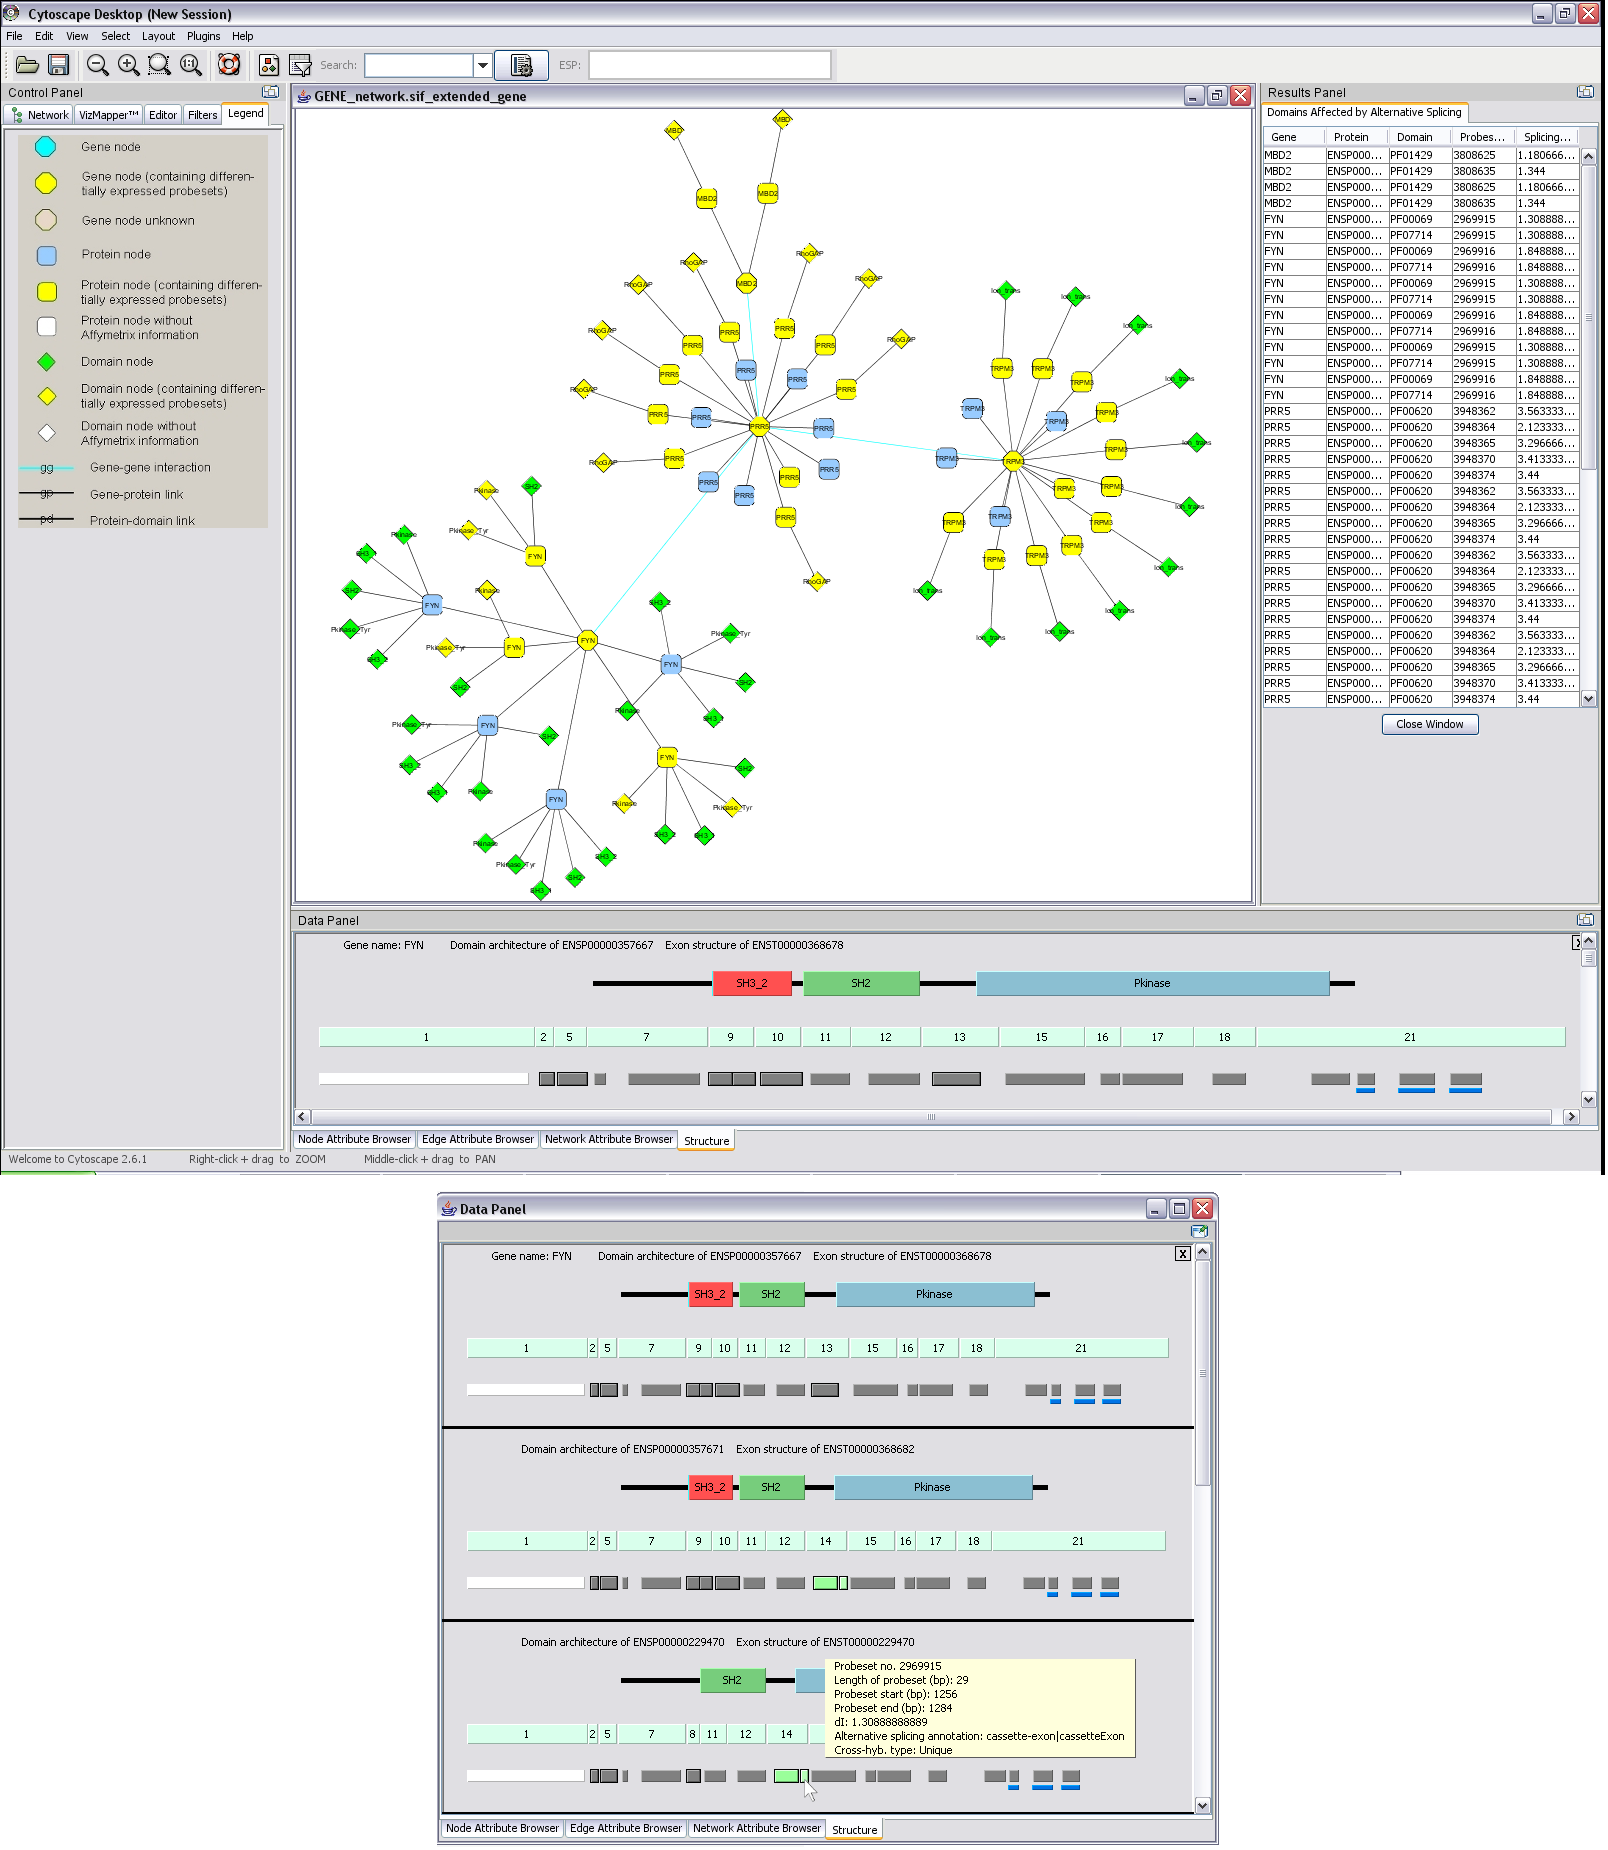
| Extended view (Gene network): | Every gene is shown together with all its proteins and their constituent Pfam domains. |
| Gene network view: | Start with the gene network only, no proteins or domains shown at the beginning. |
| Extended view (Protein network): | Every protein is shown together with all its constituent Pfam domains. |
| Compact view (Protein network): | Each Pfam domain is shown only once, and all proteins containing the domain are linked to this domain node. |
| Protein network view: | Start with the protein network without showing any domains. It is possible to individually select proteins, for which you want to see the domain composition and the domain interactions. |
DomainGraph supports the analysis of 'Single Experiment' data as well as 'Differential Expression' among groups of samples. The Affymetrix Exon Expression data can be imported into the local DomainGraph database and the data is automatically mapped onto the network. Potential alternative splicing events and differential exon expression is highlighted in the network.
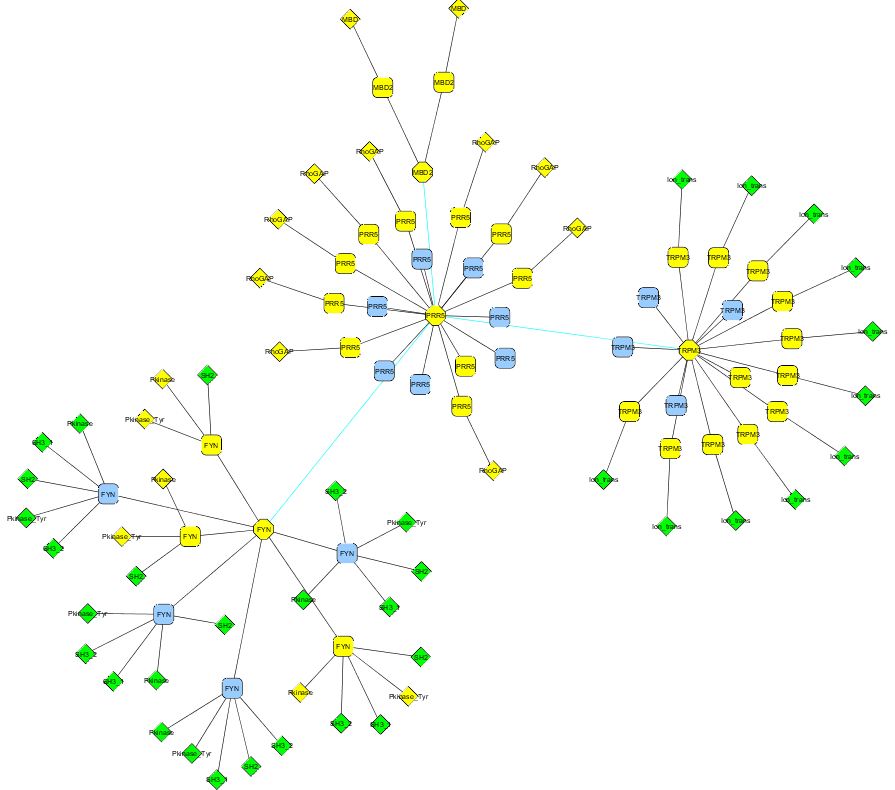
Single Experiment Data: This option can be used to analyze e.g. a single tissue with regard to potentially occurring alternative splicing events. Users simply import their expression and p-value files (see Preparing Affymetrix Exon Array data). These data are used to compute expression or non-expression of exons and domains. Potential alternative splicing events are highlighted in the network (click here for a sample output of a protein interaction network with integrated Single Experiment data).
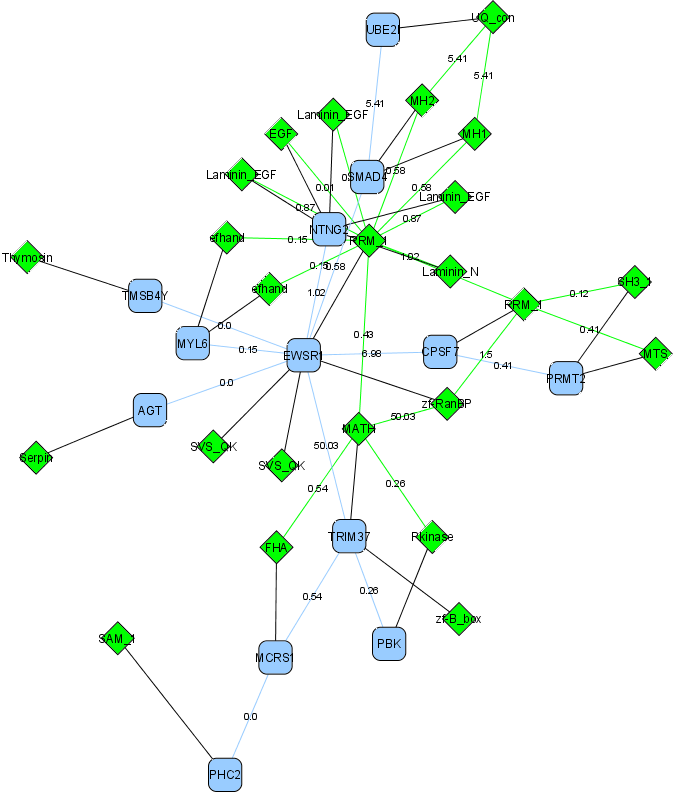
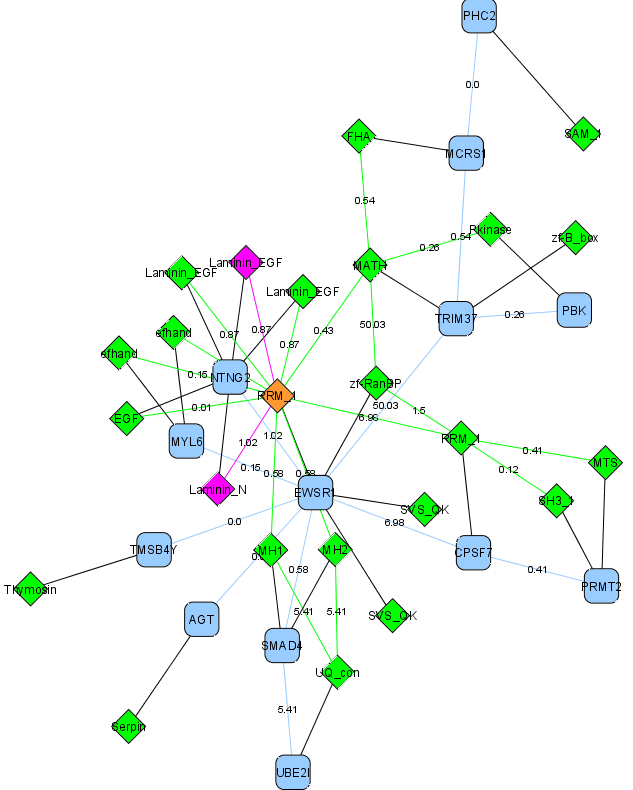
Differential Expression Data: This option is used to compare groups of samples to detect up- and downregulation events of certain exons. Protein isoforms favored in a certain sample can thus be detected easily. Users just need to import the statistics file produced by AltAnalyze, which is specifically designed for DomainGraph (see Preparing Affymetrix Exon Array data). The differential expression data are mapped onto the network. Proteins and domains potentially affected by alternative splicing are highlighted (click here for a sample output of a gene interaction network with integrated Differential Expression data).
DomainGraph provides a graphical representation of the proteins with domain architectures, the underlying exon structures, the Affymetrix Exon Array probesets, and microRNA binding sites. The graphics are available for proteins and for genes, allowing for the analysis of a single protein isoform as well as the comparison of all transcripts encoded by one gene. Tooltips provide additional information on the domains, exons, probesets, and microRNA binding sites. For 'Single Experiment' data, the probesets are colored according to their presence and absence, and expressed probesets are additionally colored according to the expression strength. Click here to see an example. For 'Differential Expression' data, the probesets are colored according to whether they were analyzed or filtered out by AltAnalyze. Moreover, differentially expressed probesets are colored according to their up- or downregulation in the samples. Click here to see an example.