Workflow 1
Contents
Installing DomainGraph
- Download and install Cytoscape 2.6
- Go to the plugins manager in the Cytoscape menu, 'Network inference' and select DomainGraph for install.
- Start DomainGraph via the plugins menu.
- Upon first usage you need to register and accept the DomainGraph license.
Installing the DomainGraph database (WITH internet connection)
- Go to the plugins menu, select DomainGraph -> Manage DomainGraph database -> Import data for selected species into database.
- Choose a local folder to install the database. Make sure to have write permission for this folder.
- Select 'Homo sapiens'.
- Select database version ENS_52.
- Click on the import button.
- Wait until a window pops up telling you the database is complete.
Installing the DomainGraph database (on a machine WITHOUT internet connection)
- You first have to install the database on a computer that is connected to the internet, as described above.
- Once you have installed the database, you can copy it to any other machine as follows:
-
- Copy the database directory (the folder that you chose for the database) to the non-connected machine.
- Example: You installed the database to "C:\Cytoscape\Database\" on the internet computer.
- You copy the "Database" folder anywhere to the non-internet computer.
- Go to the plugins menu, select DomainGraph -> Manage DomainGraph database -> Change path to database.
- Choose the "Database" directory as new path.
- The database can now be used on your non-internet computer.
General analysis of differential expression computed by AltAnalyze
This step requires a probeset statistics file produced by AltAnalyze (the appropriate file can be found in the results folder of AltAnalyze, called "YOUR_DATASET_NAME-DomainGraph.txt"). You can download a sample results file via right-click here. This sample file compares human embryonic stem cells (control group) to cardiac progenitor cells (experimental group). Save the file to your disk.
- Go to the plugins menu, select DomainGraph -> Start DomainGraph.
- Select 'Import AltAnalyze results for further analysis'.
- Click the Start button.
- Select the AltAnalyze results file and click the Open button.
- Wait for the file to be processed.
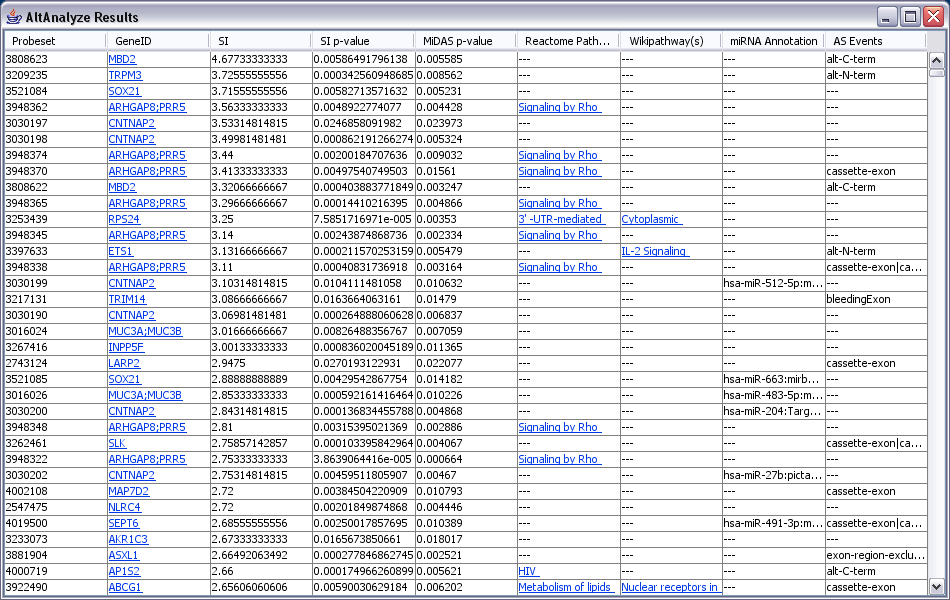
- The resulting table should look similar to this screenshot.
- The table shows the differentially expressed probesets detected by AltAnalyze. The table is enriched with information on the genes containing these probesets, the Splicing Indices (SI), the SI p-values, the MiDAS p-values, the Reactome and WikiPathway pathway(s) the genes participate in, miRNA binding sites associated with the probesets and alternative splicing (AS) annotations..
Analysis of a single gene
- Sort the table according to gene names by clicking on the header of the 'GeneID' column.
- Scroll to the entry 'FYN' in the gene column.
- Click on 'FYN'.
- Wait for the graphics to be created.
- You will receive a 'single gene'- domain graph. This network consists of the gene, all encoded proteins and their domain compositions. Nodes highlighted in yellow indicate the presence of differentially expressed probesets.
- The data panel shows the graphical representation of the protein domain architecture, the exon structure, the probeset and miRNA annotations.
- The results should look similar to this screenshot.
- Please note exon no 14 in the graphics: it shows significant down-regulation in the experimental group (cardiac progenitors) compared to the control group (human embryonic stem cells) as can be seen by the annotated probesets colored in green. This result indicates that transcripts containing exon no 14 are not favored in cardiac progenitor cells.
- Move the mouse over a domain, exon, probeset, miRNA block in the graphics. The tooltips show some additional information on the domain.
- Move the mouse over the probesets below exon no 14. The tooltip shows e.g. the Splicing Index (dI), alternative splicing annotations and cross-hybridization information.
Analysis of a WikiPathway pathway
- Sort the table according to wikiPathway pathways by clicking on the 'Wikipathway(s)' header.
- Scroll to an entry containing 'Apoptosis' in the Wikipathway column.
- Click on 'Apoptosis'.
- A new window opens displaying all pathways associated with the probeset's gene. Click on 'Apoptosis' in this window and then on the 'Submit' button.
- Wait for the WikiPathway pathway to be loaded. Please note that you need to have an internet connection to load pathways!
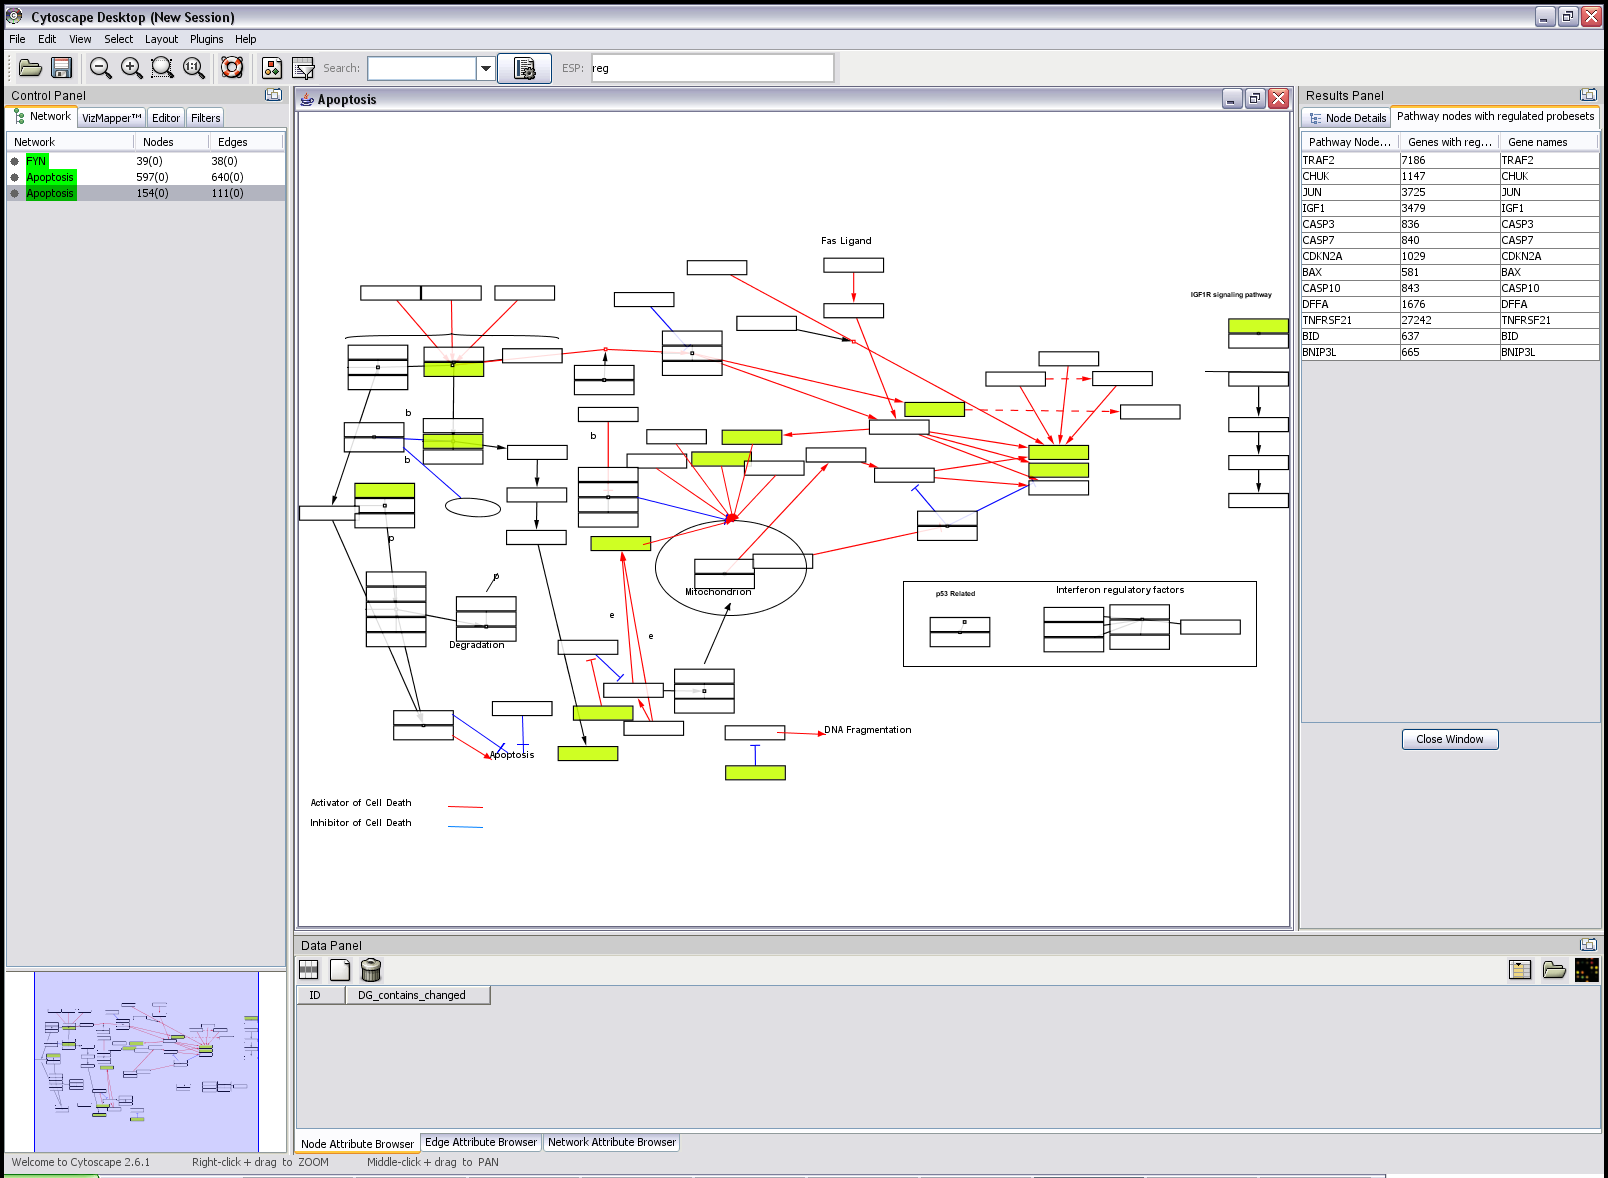
- The resulting pathway should look similar to this screenshot.
- Pathway nodes associated with differentially expressed probeset are highlighted.
- The table in the results panel shows the node ids, gene ids and gene names for regulated nodes.
- Please note that you can import this pathway into DomainGraph if you want to further analyze it. The WikiPathway nodes are automatically annotated with an attribute called 'DG_WikiPathway_EnsG'. This attribute is used for making this pathway a Domain Graph.
Transforming a WikiPathway pathway into a gene interaction Domain Graph
- Go to the plugins menu, select DomainGraph -> Start DomainGraph.
- Select 'Create domain graph for gene or protein interaction network'.
- Click the Start button.
- Select 'Visualize gene interaction network'.
- Click on the drop-down menu to select/import gene interactions.
- Select 'Apoptosis'. (This is the WikiPathway that you just loaded).
- Leave the network view on 'extended' and identifier on 'Ens Gene'.
- Click the Submit button.
- A window pops up asking which node attribute contains the gene ids. Select 'DG_Wikipathway_EnsG' and click OK.
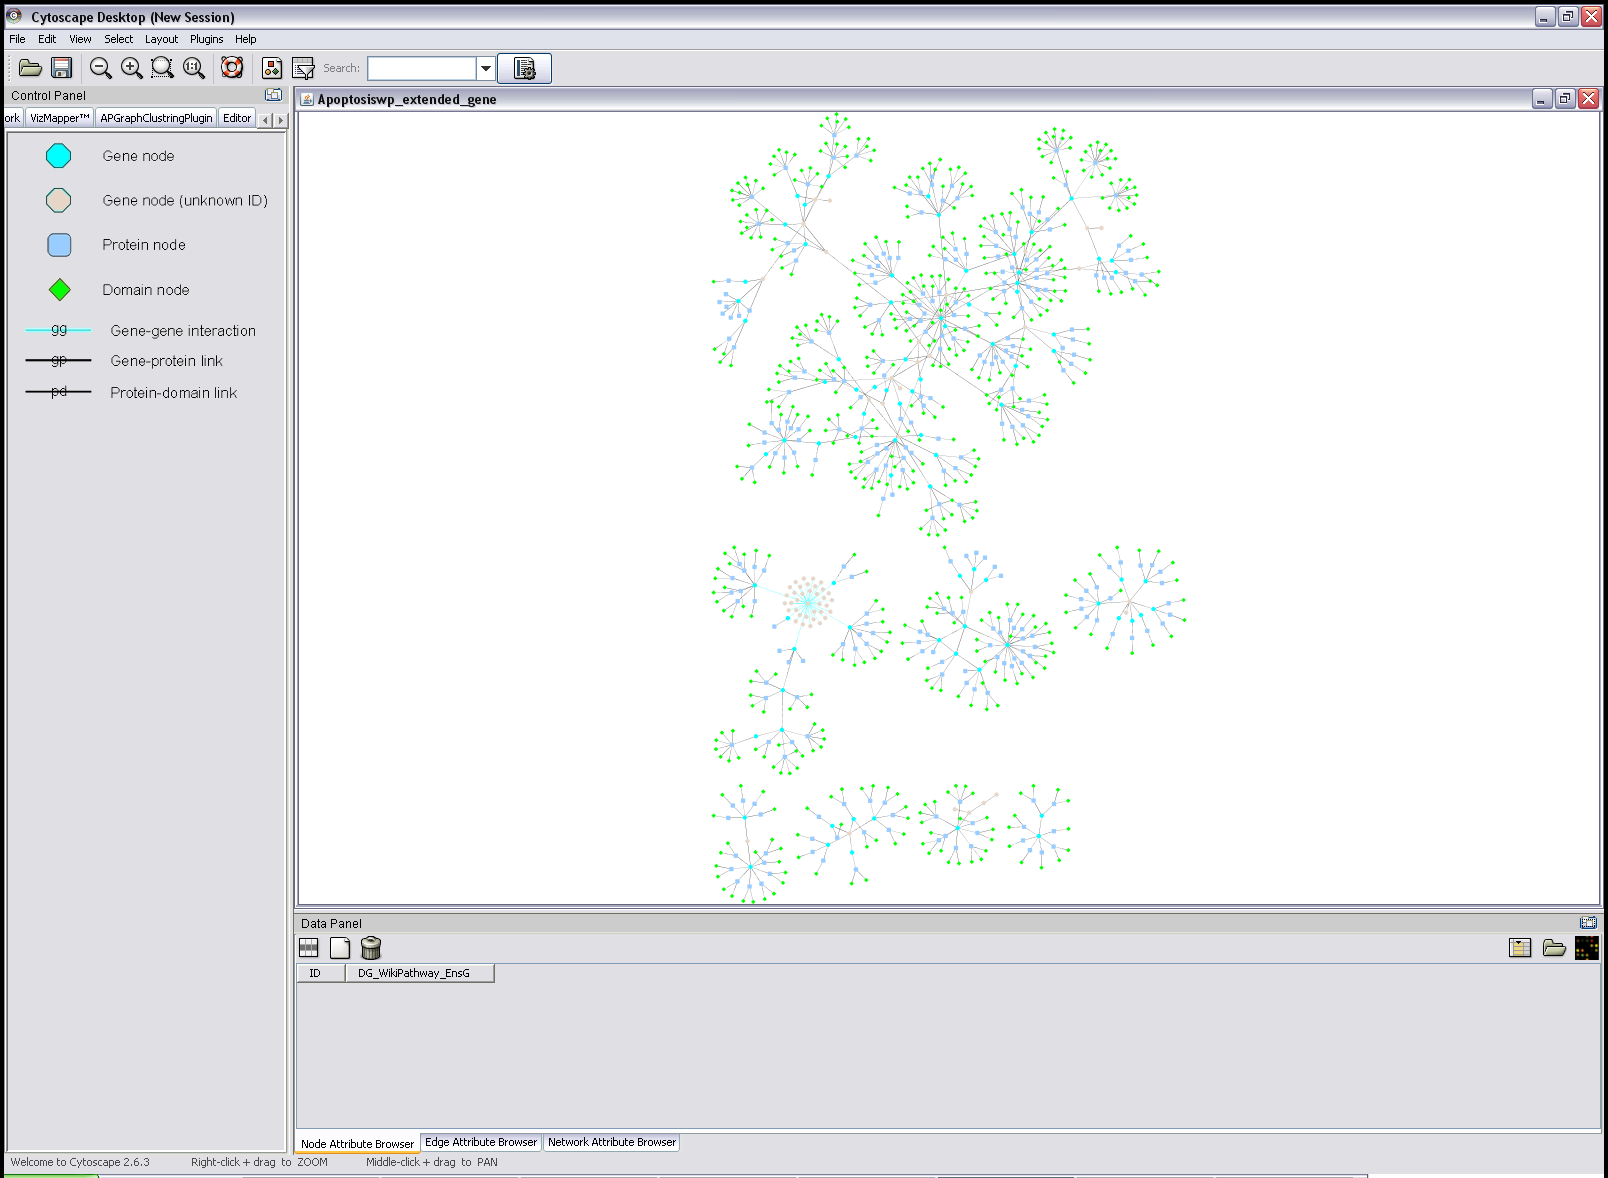
- The resulting domain graph consists of the input genes and gene interactions and is enriched by the protein isoforms encoded by the genes together with their domain compositions.
- Your resulting network should look similar to this screenshot.
- If you want to overlay the network with your AltAnalyze results and further analyze your data, continue here ("Integrating Affymetrix Exon Array data produced by AltAnalyze for analyzing differential exon expression").
Analysis of a Reactome pathway
- Sort the table according to Reactome pathways by clicking on the 'Reactome pathway(s)' header.
- Scroll to an entry containing 'Apoptosis' in the Reactome column.
- Click on 'Apoptosis'.
- A new window opens displaying all pathways associated with the probeset's gene. Click on 'Apoptosis' in this window and then on the 'Submit' button.
- Wait for the Reactome pathway to be loaded. Please note that you need to have an internet connection to load pathways!
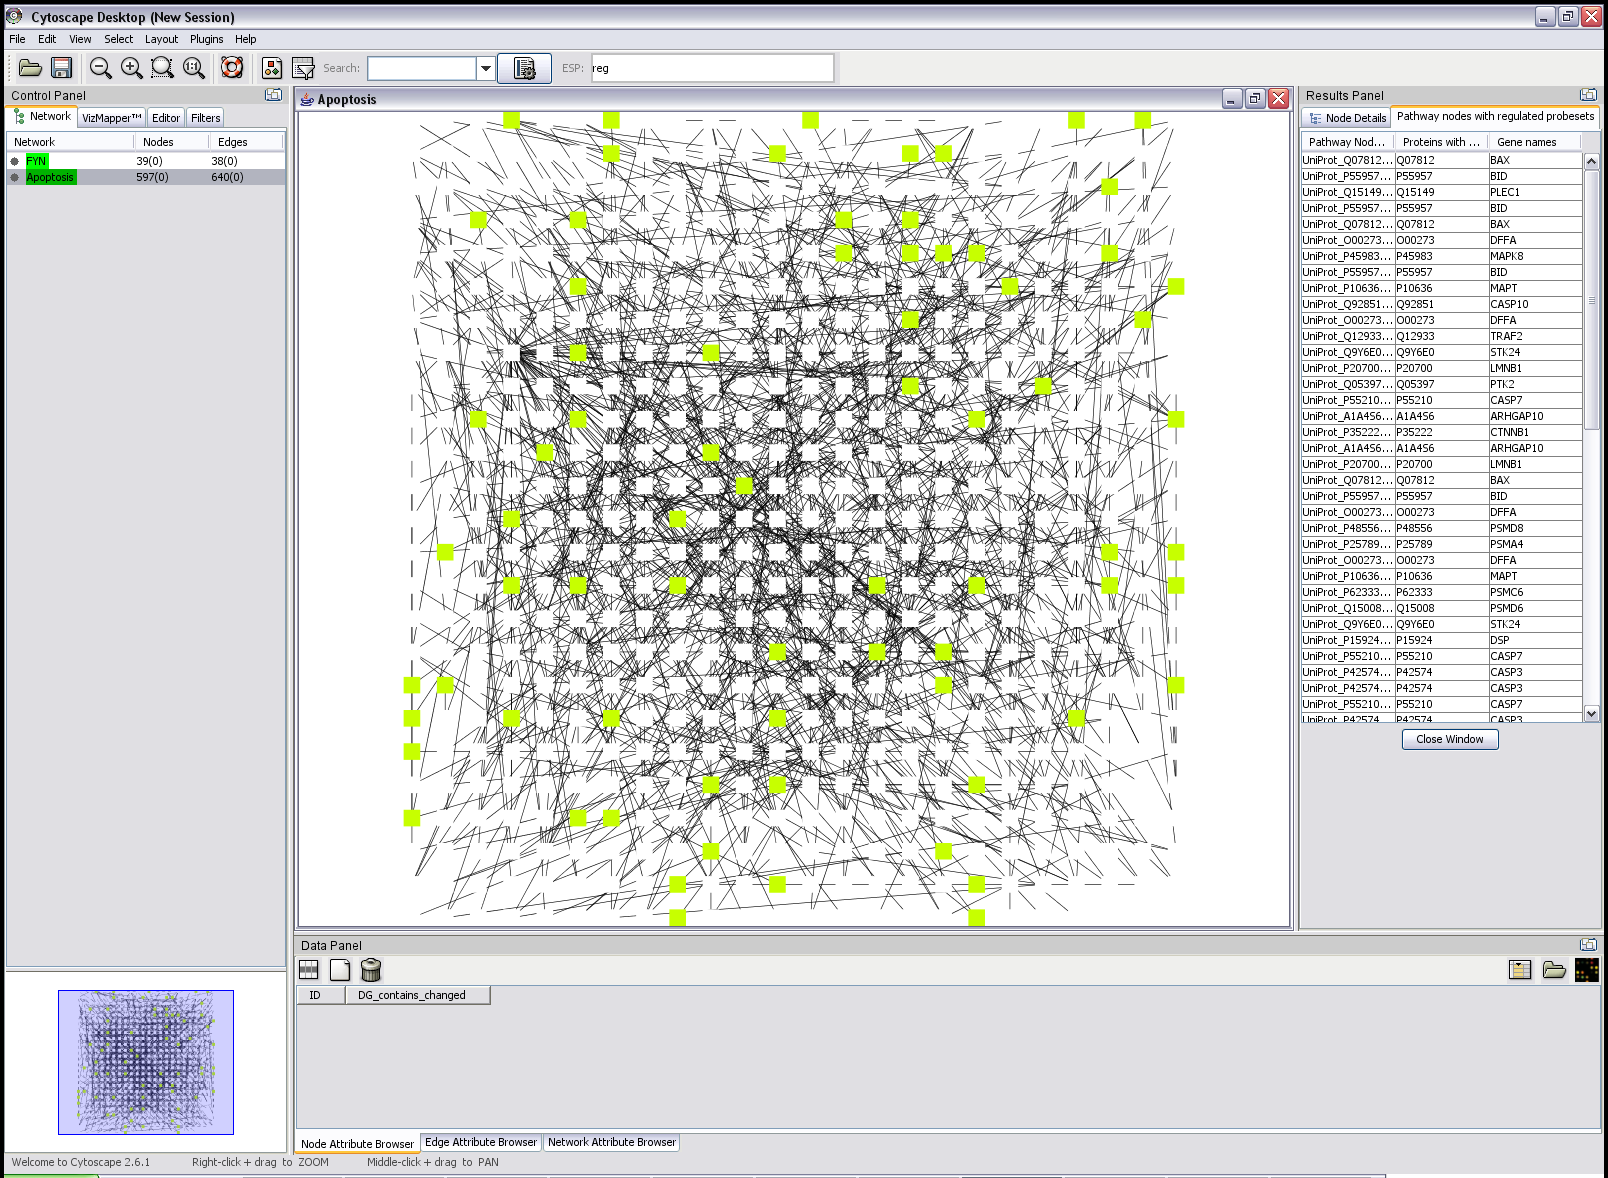
- The resulting pathway should look similar to this screenshot.
- Pathway nodes associated with differentially expressed probeset are highlighted.
- The table in the results panel shows the node ids, UniProt proteins and gene names for regulated nodes.
- Please note that you can import this pathway into DomainGraph if you want to further analyze it (see workflows 2 and 3).
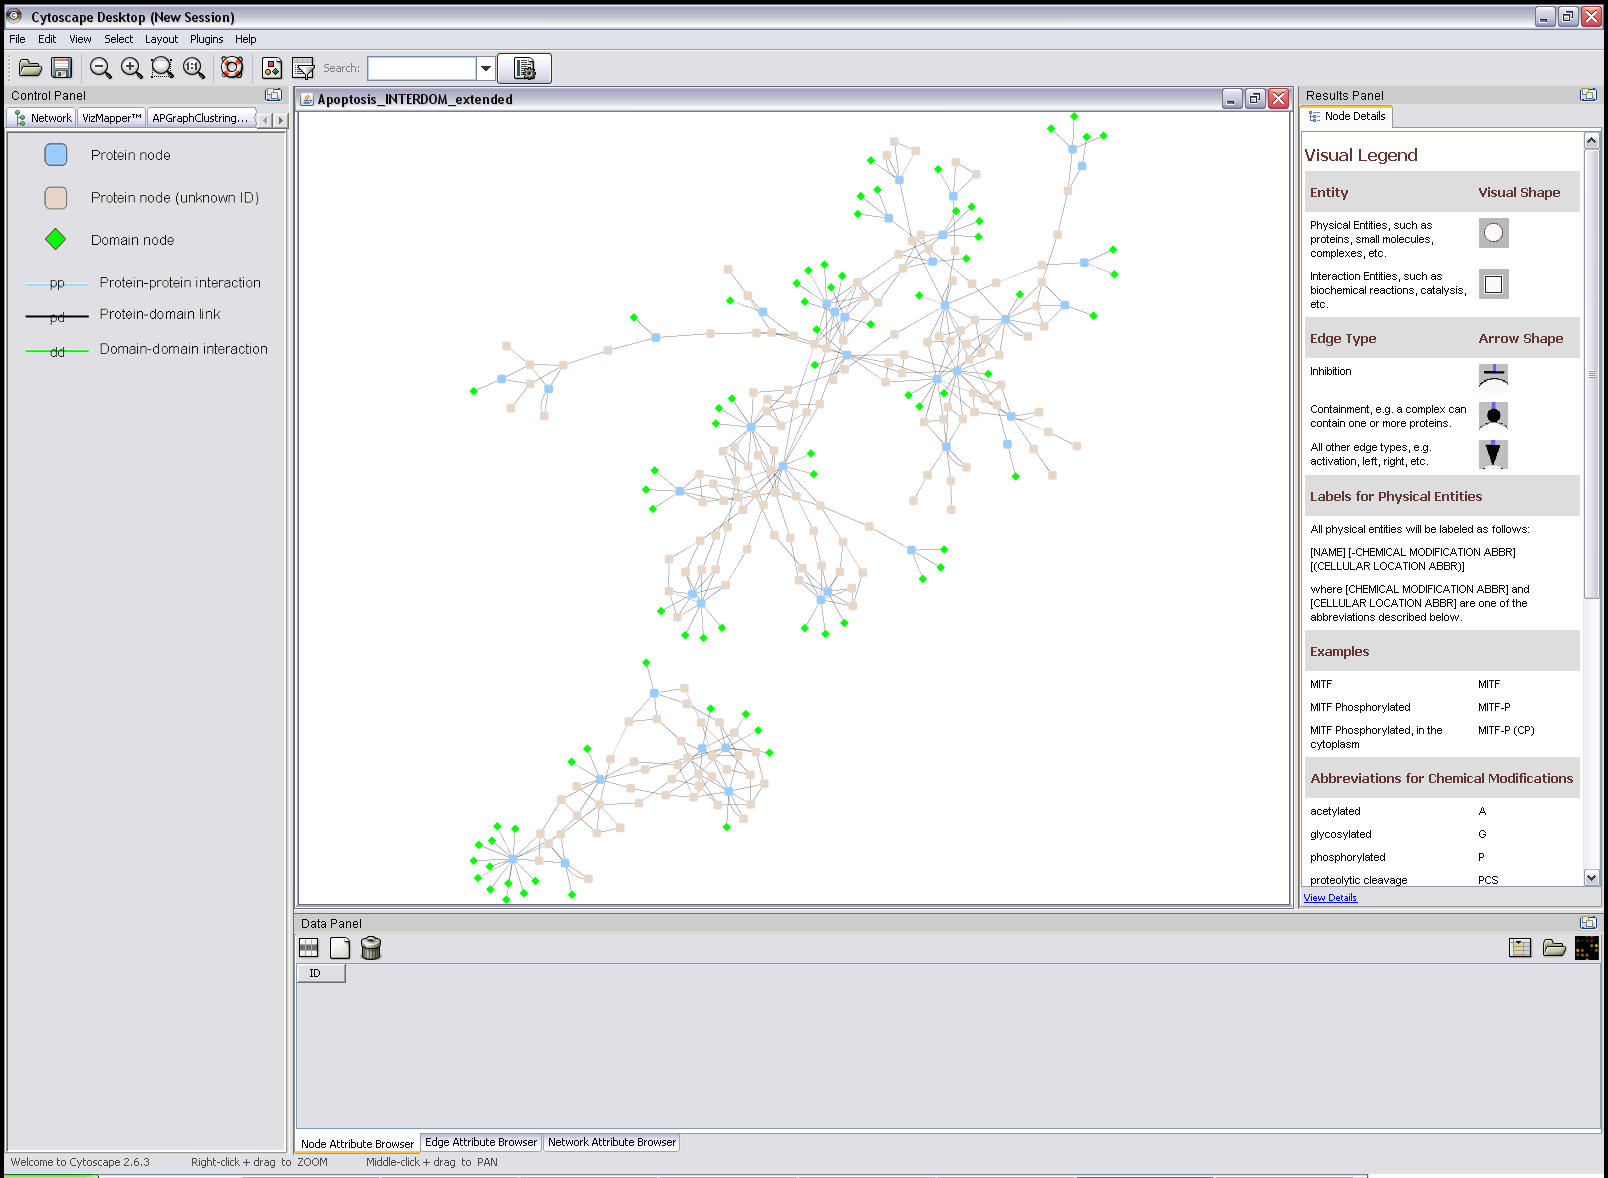
Transforming a Reactome pathway into a protein interaction Domain Graph
- Go to the plugins menu, select DomainGraph -> Start DomainGraph.
- Select 'Create domain graph for gene or protein interaction network'.
- Click the Start button.
- Select 'Visualize protein interaction network'.
- Click on the drop-down menu to select/import protein interactions.
- Select 'Apoptosis'. (This is the Reactome pathway that you just loaded).
- Click on the second drop-down menu to select domain interactions. Choose 'InterDom' as domain interaction dataset.
- Leave the network view on 'extended' and identifier on 'UniProt'.
- Click the Submit button.
- A window pops up asking which node attribute contains the gene ids. Select 'biopax.xref.UniProt' and click OK.
- The resulting domain graph consists of the input proteins and protein interactions and is enriched by the domain compositions and domain interactions occurring according to InterDom.
- Your resulting network should look similar to this screenshot.
- If you want to overlay the network with your AltAnalyze results and further analyze your data, continue here ("Integrating Affymetrix Exon Array data produced by AltAnalyze for analyzing differential exon expression").
