Workflow 3
Contents
Installing DomainGraph
- Download and install Cytoscape 2.6
- Go to the plugins manager in the Cytoscape menu, 'Network inference' and select DomainGraph for install.
- Start DomainGraph via the plugins menu.
- Upon first usage you need to register and accept the DomainGraph license.
Installing the DomainGraph database (WITH internet connection)
- Go to the plugins menu, select DomainGraph -> Manage DomainGraph database -> Import data for selected species into database.
- Choose a local folder to install the database. Make sure to have write permission for this folder.
- Select 'Homo sapiens'.
- Select database version ENS_52.
- Click on the import button.
- Wait until a window pops up telling you the database is complete.
Installing the DomainGraph database (on a machine WITHOUT internet connection)
- You first have to install the database on a computer that is connected to the internet (as described above).
- Once you have installed the database, you can copy it to any other machine as follows:
- Copy the database directory (the folder that you chose for the database) to the non-connected machine.
- Example: You installed the database to "C:\Cytoscape\Database" on the internet computer.
- You copy the "Database" folder anywhere to the non-internet computer.
- Go to the plugins menu, select DomainGraph -> Manage DomainGraph database -> Change path to database.
- Choose the "Database" directory as the new path
- The database can now be used on your non-internet computer.
Importing a gene interaction network into DomainGraph
This step requires a gene interaction network, given with Ensembl or Entrez gene ids. You can download a toy gene interaction network containing human genes via right-click here. Save the file to your disk.
- Go to the plugins menu, select DomainGraph -> Start DomainGraph.
- Select 'Create domain graph for gene or protein interaction network'.
- Click the Start button.
- Select 'Visualize gene interaction network'.
- Click on the drop-down menu to select/import gene interactions.
- Select 'Import own network'.
- Choose the location of your gene interaction network.
- Leave the network view on 'extended' and identifier on 'Ens Gene'.
- Click the Submit button.
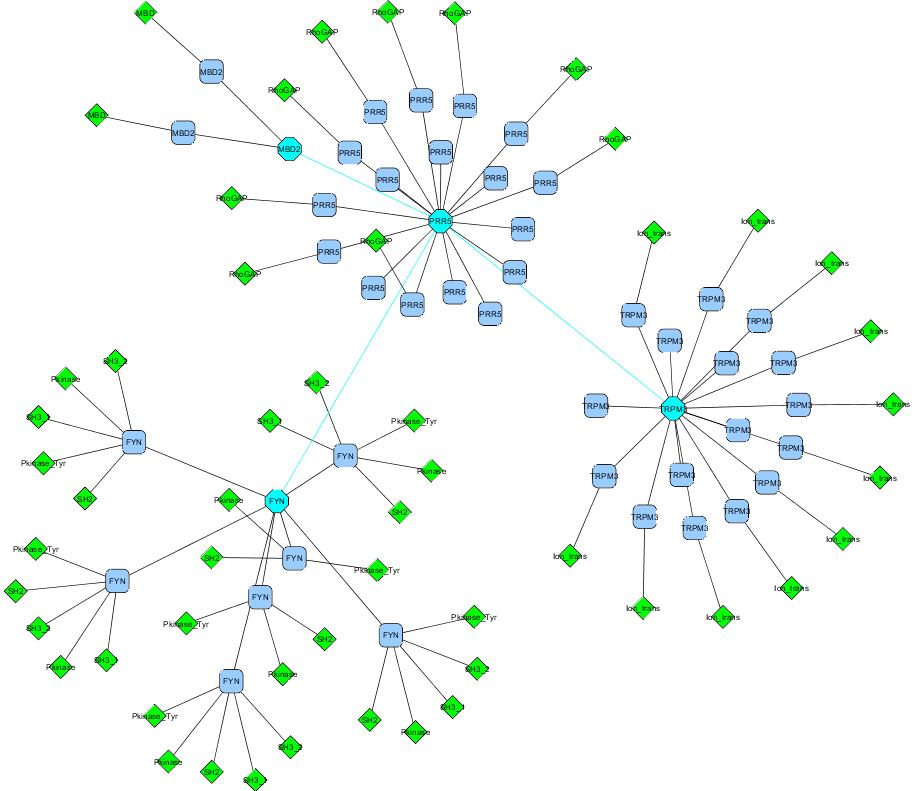
- The resulting domain graph consists of the input genes and gene interactions and is enriched by the protein isoforms encoded by the genes together with their domain compositions.
- Your resulting network should look similar to this screenshot.
Integrating Affymetrix Exon Array data produced by AltAnalyze for analyzing differential exon expression
This step requires a results file produced by AltAnalyze (in the results folder of AltAnalyze, called "YOUR_DATASET_NAME-DomainGraph.txt"). You can download a sample results file via right-click here. This sample file compares human embryonic stem cells (control group) to cardiac progenitor cells (experimental group). Save the file to your disk.
- Go to the plugins menu, select DomainGraph -> Integrate Affymetrix exon expression data.
- Select the 'AltAnalyze data' tab.
- Click the Import button.
- Select the sample data for import.
- Type in a name for this dataset and click on Import.
- Once the data is imported, it is shown in the drop-down menu.
- Click the OK button and wait for the data integration.
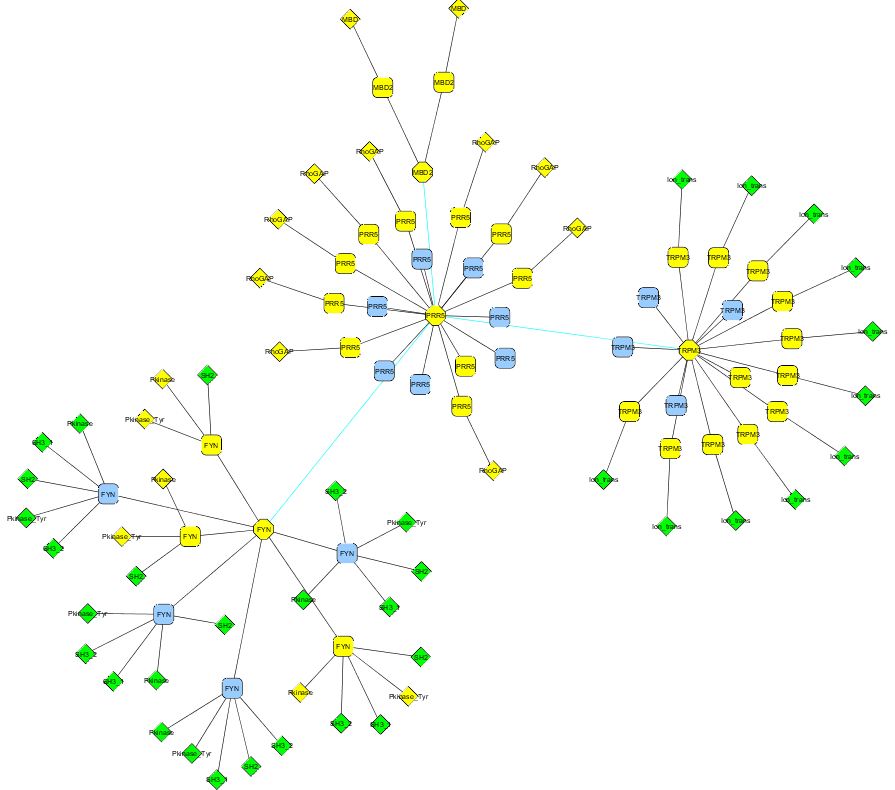
- In the resulting domain graph, all genes, proteins and domains containing differentially expressed probeset are highlighted in yellow.
- Your resulting network should look similar to this screenshot.
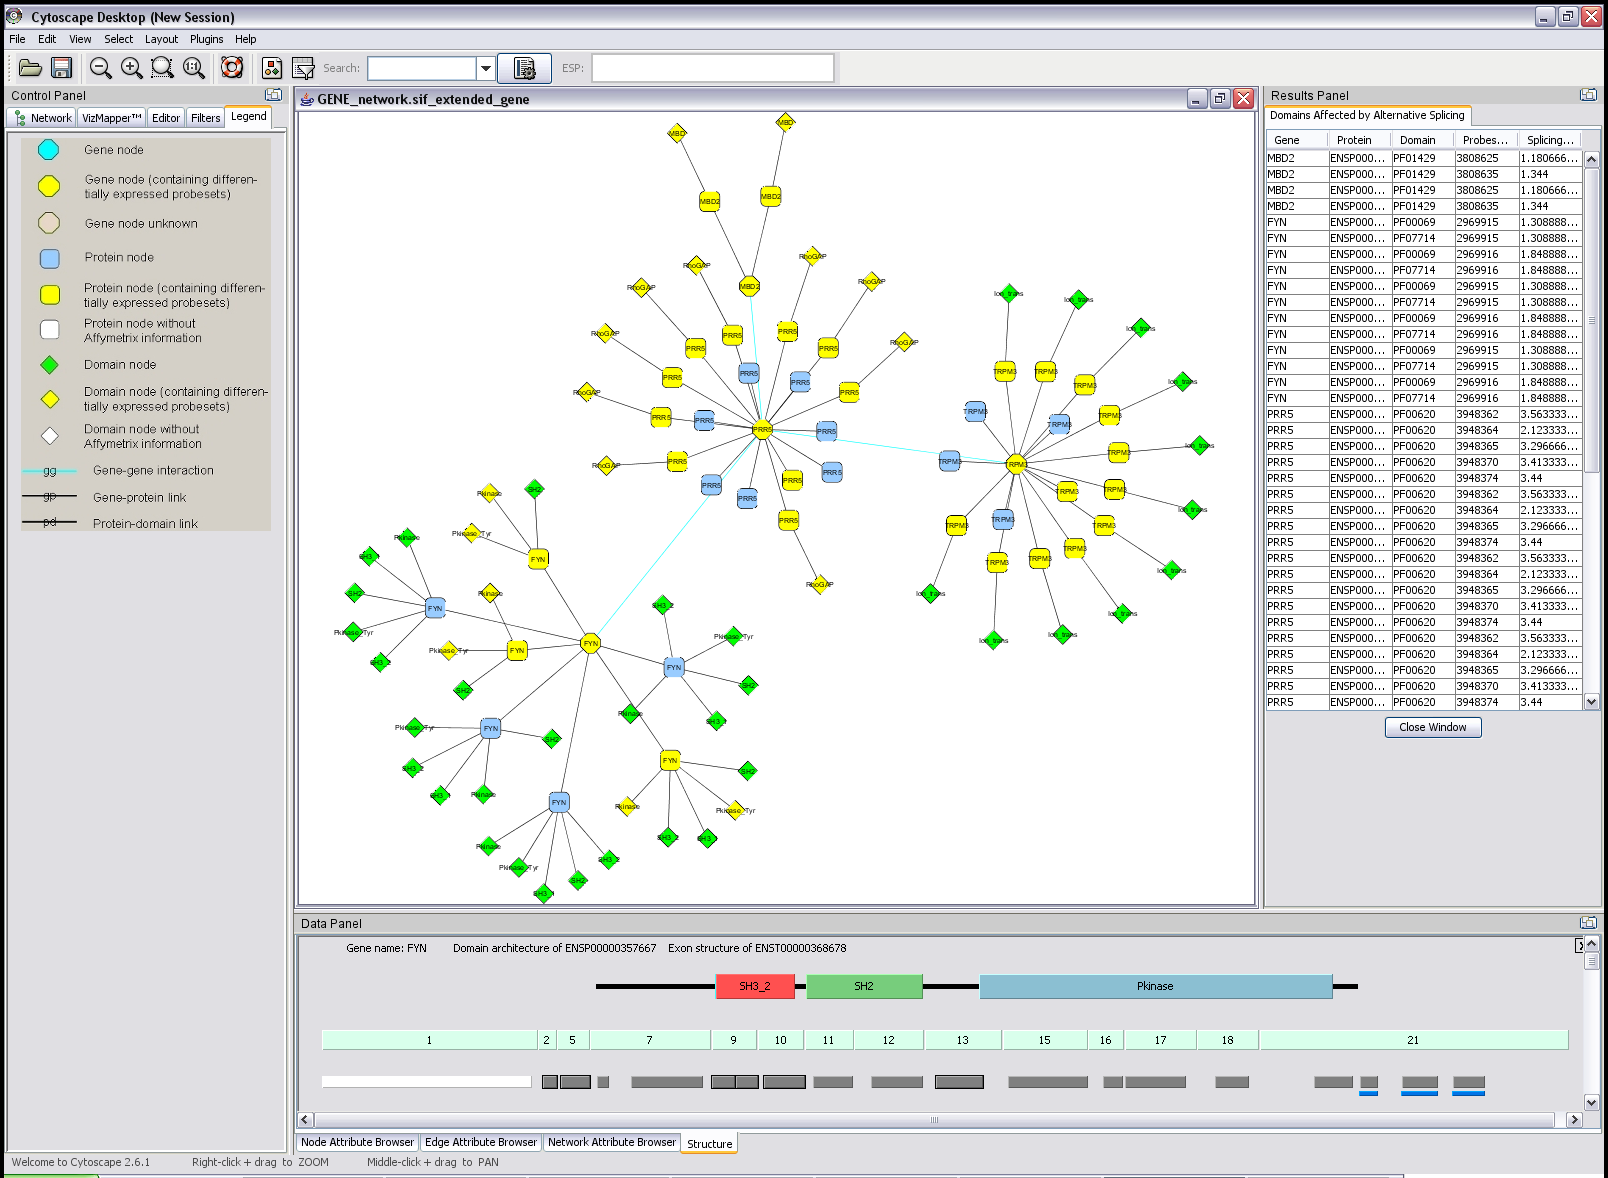
- In the results panel on the right you can see the genes, proteins, domains, and probesets that are differentially expressed in the two samples together with their splicing indices.
- Click on a row in the results panel to select the respective node in the network.
Viewing proteins, domains, exons, probesets, and miRNA binding sites as graphics
- Double-click on the gene node labelled 'FYN' (you might have to zoom in to be able to read the node labels).
- The graphics is displayed in the data panel and should look similar to this screenshot.
- The top row of an entry shows the protein with its contained domains (colored rectangles).
- Below is the exon structure including 5' and 3' UTRs. Identical exon numbers in different transcripts indicate identical exons.
- Below are the probesets. White coloring means the probeset was not statistically analyzed by AltAnalyze due to pre-filtering steps. Gray probesets are expressed at similar levels in both groups of samples. Differentially expressed probesets are shown in red (up-regulated in the experimental group) and green (down-regulated in the experimental group).
- Scroll down the graphics. Please note the down-regulated (highlighted by green-colored probesets) exon no 14. This result indicates that protein isoforms containing exon no 14 are down-regulated in cardiac progenitor cells.
- Blue rectangles below some probesets indicate microRNA binding sites.
- Move the mouse over the domains, exons, probesets, and miRNAs. Tooltips providing additional information are shown.
- Move the mouse over the green-colored probesets annotated to exon no 14. The tooltips display that exon no 14 is known to be a cassette exon, supporting the potential alternative splicing event. The Cross-hybridization information shows that both these probesets are 'unique'. This means, the probesets were specifically designed for this genomic locus and (at design-time of the microarray) did not align to any other transcript.
- Right-click somewhere in the data panel. A menu will pop up for customizing and saving the graphics.
- Click on an exon. This will open the corresponding Ensembl website for further information.
